The Rest of the Story: What EFRs can show YOU

By Steve Cubbage, VP Farmobile Services & CEO Record Harvest
. . .
Growing up on our family farm, one of my favorite memories was working the fields with our John Deere 4430 tractor. I guess the reason I liked it so much was that it had a cab, an air-conditioner and, most of all, that “state-of-the art” AM radio all of which was a significant upgrade from the John Deere 4020 to which I was relegated just a few years earlier.
The greatest perk had to be the radio because I listened for hours on end to the music of the ‘70s. You know, the Doobie Brothers and the Steve Miller Band on 710 WHB out of Kansas City. But come 5’clock in the afternoon I would switch the dial back to my local station for my daily dose of Paul Harvey’s: The Rest of the Story.
The Rest of the Story could really be considered the ‘70s variant of today’s TED Talks and podcasts. Mr. Harvey rarely disappointed as there was almost always more to the story that you didn’t know just 5 minutes before.
We’ve come a long way in farming since those days in the field with that 4430 tractor. There’s more horsepower, more technology. But still, even with all of these advancements, there’s always more to the story when it comes to learning about the life of the fields on your farm.
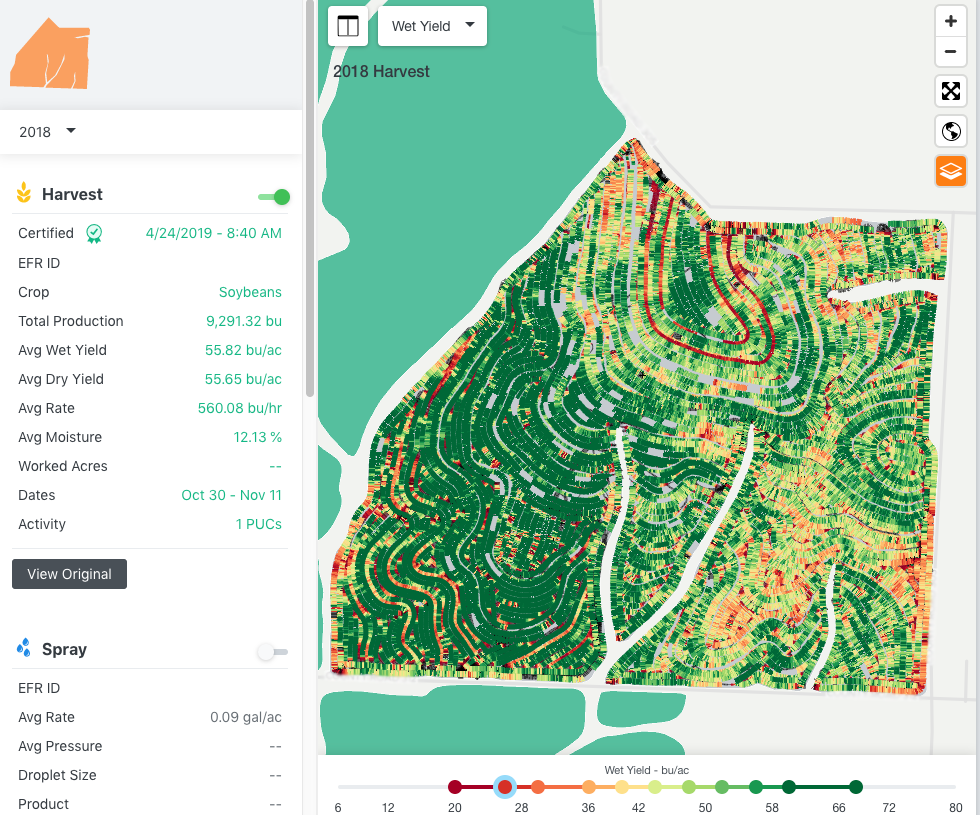
I see that in nearly every colorful harvest yield map I look at. Sometimes the variations in color are particularly stark. Invariably I almost always ask myself the same questions over and over — what happened in this field and why? In my nearly 25 years of looking at yield maps, this exercise never gets old.
EFRs + a Full-Crop Story
That’s why, when I was going through one of our client’s 2018 Electronic Field Records (EFRs), a particular field caught my eye. There was clearly something going on and, after clicking through a few more of the grower’s EFRs and heat maps, I thought I’d found it.
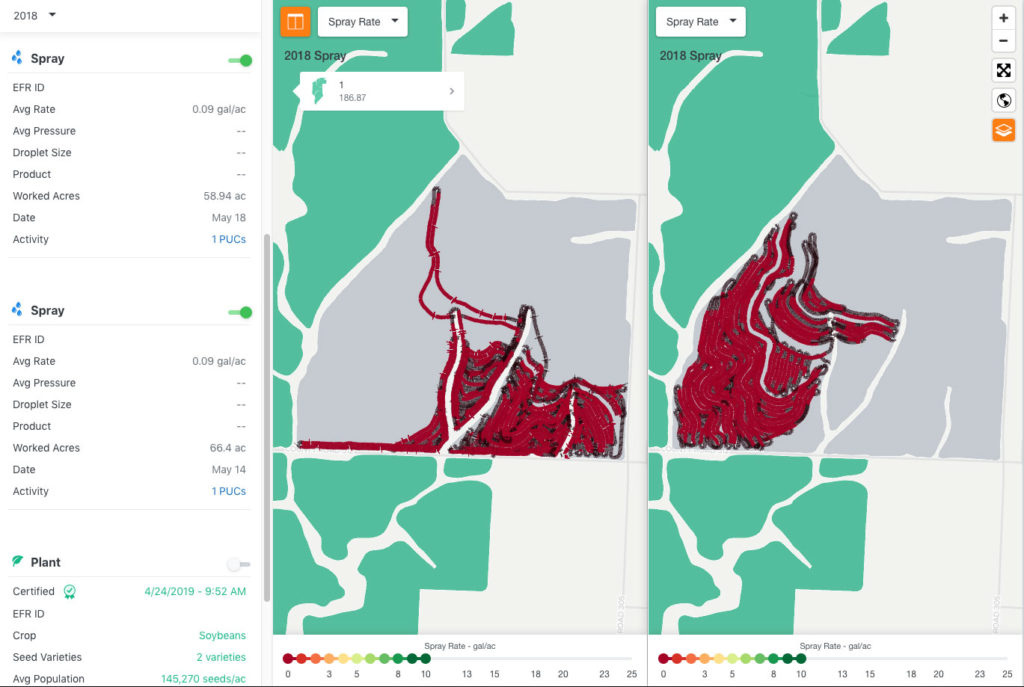
It just so happened that at planting, the grower had applied a test starter fertilizer on a portion of one particular field. At first glance, things seemed to line up. It appeared there was a huge yield increase
Was it really possible that starter on soybeans could increase yields 10 to 15 bushels per acre?

Not so fast Sherlock…
A quick phone call with the farmer to glean his thoughts proved once again that data analysis requires context. That is, omitting the farmer from the conversation can lead to inaccurate conclusions.
According to the grower, he was experimenting with starter fertilizer in a section of the field that almost mirrored the places where he had also changed soybean varieties. A side-by-side comparison of the as-applied heat maps within the Farmobile DataEngine℠ (below) shows that, overall, the starter just didn’t move the needle on yields.

On the other hand, seed variety did – by a lot.
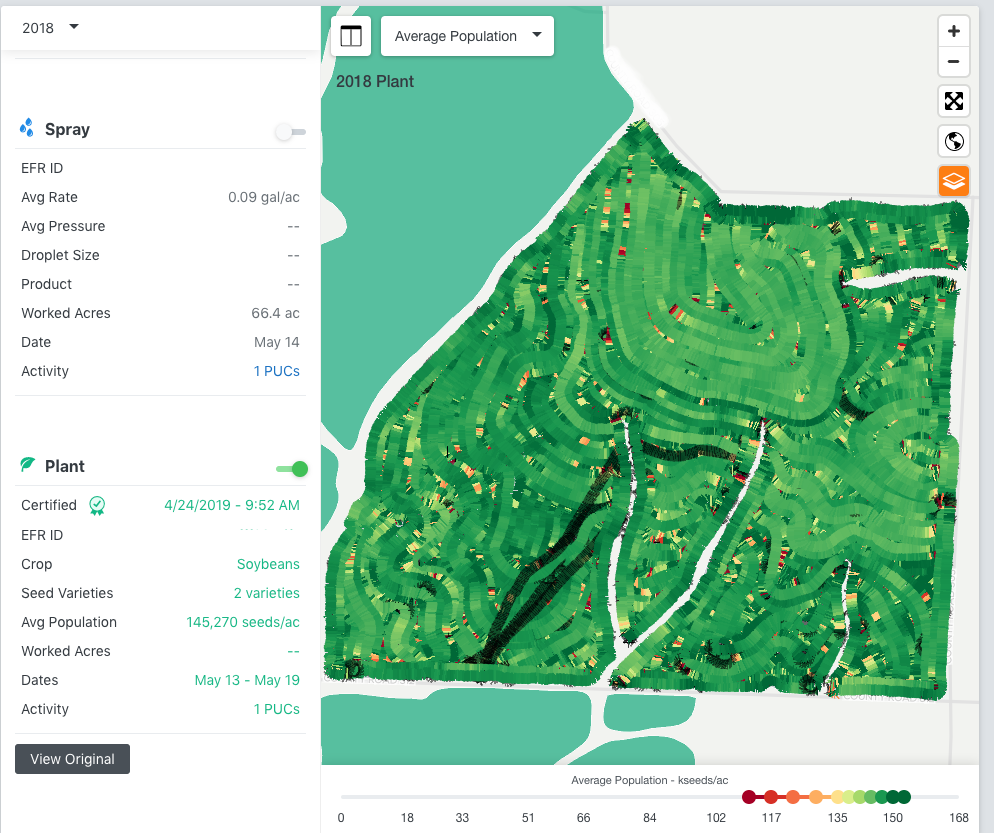
The planting EFRs (image below) shows how seed variety affected yields. According to the farmer, one seed variety was, unfortunately, susceptible to Sudden Death Syndrome, better known as SDS. Stressful weather during the 2018 growing season ultimately brought SDA incidents to the forefront and this test field was a great example.
Consequently, the seed variety that showed more tolerance literally resulted in nearly 15 bushels per acre advantage over the more susceptible one. So, the seed variety, not the fertilizer, was the “true hero” in this scenario. And, the availability of multiple activity EFR layers plus the farmer’s backstory helped to tell and visualize the rest of the field’s crop story.

EFRs help tell the “Rest of the Story”
For those of us who deal in data every day, this was one of those Paul Harvey teachable moments. There is ALWAYS more to the story.
And, unlike Newton’s Third Law of Physics, not every action in “farming” has an equal and opposite reaction.
Certain actions and choices, like selecting a different seed variety, sometimes have much more impact on yield and bottomline than say, “putting a dose of starter fertilizer on your soybeans.” However, you never know what is going to move the needle — big or small — and it all adds up.
Farmobile EFRs give farmers and trusted advisors a distinct advantage for deriving insights about what happened in the field. Farmers have 24-7, anytime access to EFRs which provide visual proof of concept for field management and input changes season-over-season. Start comparing EFRs on a single-screen across field activity (as-applied, as-planted, as-harvest), years, crop, seed, and other attributes and impacts.
That’s a tool that you just can’t ignore.
You can also use and compare Electronic Field Records via the Farmobile DataEngine platform. Contact Farmobile Customer Support for help.

Steve Cubbage
VP of Farmobile Services and president and owner of Record Harvest. Passionate about precision agriculture and data collection.